![图片[1]-Jeff Cooper & David Reif Unlocking the Profits of the New Swing Chart Method-TheTrendFollowing](https://150220.xyz/wp-content/uploads/2024/09/1a92b38369173017.jpg)
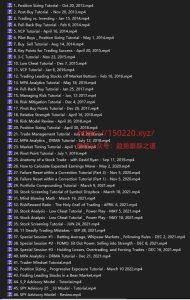
More than 10 hours of videos
Described as taking the art and science of chart analysis from black-and-white analog TV to digital HD, the method applies the value of time to traditional swing charting, along with Gann’s Square of 9 theory, to expose the clockwork mechanism of the markets. It clearly defines the various cogs and gears that drive market trends and shows how they interact, while explaining how to generate visible, actionable buy and sell signals.
© 版权声明
文章版权归作者所有,未经允许请勿转载。
THE END


![4、[技术教程]回撤买入法视频教程 PullBack Buy Tutorial By Mark Minervini 中英字幕人工校正-TheTrendFollowing](https://150220.xyz/wp-content/uploads/2023/05/07aee2b72d084244-300x211.png)


